Commodities: Telling a Different Story?

By Brett Friedman of Winhall Risk Analytics and OptionMetrics Contributor
Things seem to be looking up for the US economy. GDP growth is good, inflation is moderating, and interest rates are on the decline. Despite these favorable indicators, commodities are telling a different story. Broadly speaking, commodities, as measured by both the Goldman Sachs Commodity Index (GSCI) and the Bloomberg Commodity Index (BCOM) have been decreasing since the middle of 2022; as of February 1, they were 31% and 28.1% lower since 06/01/2022, respectively.
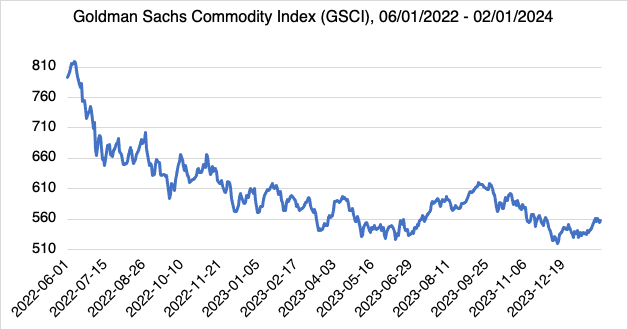
Source: S&P Dow Jones Indices
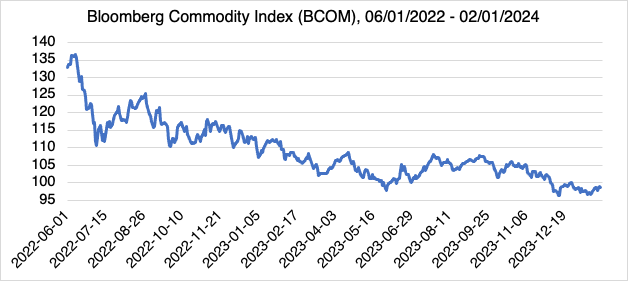
Source: Yahoo! Finance
Indeed, the major components of both indexes -- energy, industrial metals, and agriculture -- have all been declining since they made post-pandemic highs in June 2022. Energy, which comprises the greatest weight in both the GSCI (61.5%) and BCOM (29.95%), and is potentially the most influenced by geopolitical conflicts, is down almost 39% since then. Almost as significant are agricultural commodities, which continue to decline despite the fact that Ukraine is a major international supplier of wheat, corn, and oilseeds, as well as the continued shipping curtailments in the Mideast. Tellingly, and going back even further, BCOM is currently below the lows made during the 2009 Great Recession.
|
Index |
Percentage Change 06/01/2022-02/01/2024 |
|
GSCI |
-31% |
|
BCOM |
-28.1% |
|
GSCI Energy |
-38.7% |
|
GSCI Agricultural |
-30.8% |
|
GSCI Industrial Metals |
-18.6% |
|
GSCI Livestock |
19.3% |
|
GSCI Precious Metals |
10.5% |
Source: S&P Dow Jones Indices
The only bright spots in commodities are livestock and precious metals, the latter supported by central bank purchases and the wars in Ukraine and the Middle East.
In addition, the implied volatility of the GSCI, as measured by the iShares S&P GSCI Commodity-Indexed Trust ETF (GSG), has also been declining, and is currently hovering around the 22% level. Two major conflicts, the wars in Ukraine and the Middle East, both with the potential to disrupt supplies, have provided only temporary volatility support.
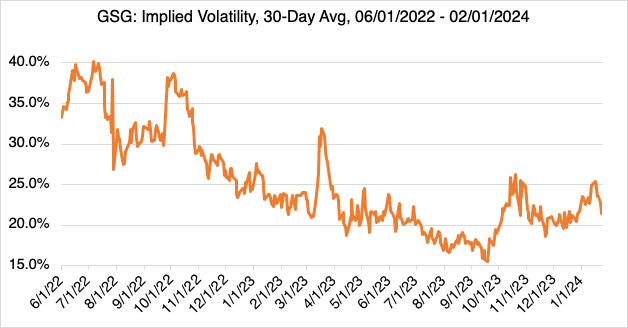
Source: OptionMetrics
The implied volatility of the indexes' most important components have also shown impressive declines:
|
Index |
Implied Volatility Change, 06/01/2022 - 02/01/2024, (absolute change, %) |
|
iShares S&P GSCI Commodity-Indexed Trust ETF (GSG) |
-10.3 |
|
Crude Oil (WTI) |
-15.8 |
|
Crude Oil (Brent) |
-16.0 |
|
Natural Gas |
-38.7 |
|
Copper |
-8.90 |
|
Chicago Wheat |
-13.5 |
|
Corn |
-17.8 |
Source: OptionMetrics
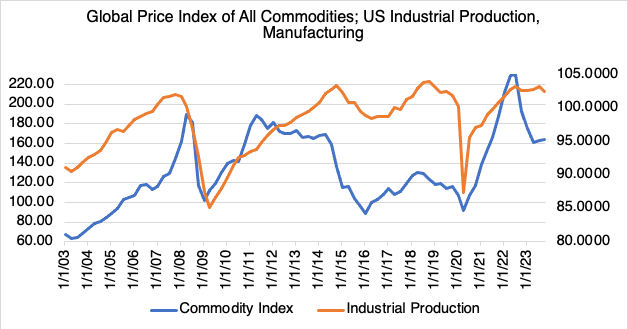
Source: FRED Economic Data, St. Louis Fed
The long term trend for commodity prices and implied volatility remains unencouraging. The steep declines in the latter indicates that the commodity markets are relatively complacent regarding declining prices.
Commodities are a notoriously imperfect predictor of future overall economic conditions, but one may conclude that commodities are acting as a moderating influence on inflation, In addition, the degree and length of their decline may have implications for both future economic growth, domestic and internationally. Since commodity prices can be viewed as a leading indicator of general economic conditions and US industrial production (see chart above), albeit imperfect, their lackluster performance is troubling if you believe that more robust growth will continue, and may be suggestive that only lackluster growth lies ahead. This is in contrast to the cautiously optimistic consensus forecasts that seem to be dominating the current narrative.
Found this useful?
Take a complimentary trial of the FOW Marketing Intelligence Platform – the comprehensive source of news and analysis across the buy- and sell- side.
Gain access to:
- A single source of in-depth news, insight and analysis across Asset Management, Securities Finance, Custody, Fund Services and Derivatives
- Our interactive database, optimized to enable you to summarise data and build graphs outlining market activity
- Exclusive whitepapers, supplements and industry analysis curated and published by Futures & Options World
- Breaking news, daily and weekly alerts on the markets most relevant to you